(best
viewed at 800 x 600)
| Education Statistics | |||
|
|||
|
Shamblesguru's Live Twitter Stream
https://twitter.com/shamblesguru Tweets by @shamblesguru |
|
|
|
|
|
Best Education In The World [2012]
http://huff.to/15l9QgV Best Education In The World: Finland, South Korea Top Country Rankings, U.S. Rated Average Finland and South Korea, not surprisingly, top the list of 40 developed countries with the best education systems. Hong Kong, Japan and Singapore follow. The rankings are calculated based on various measures, including international test scores, graduation rates between 2006 and 2010, and the prevalence of higher education seekers. (See the list of top 20 countries in the slideshow on the page) |
|
|
|
|
|
Open Doors Data
http://www.iie.org/en/Research-and-Publications/Open-Doors/Data Welcome to the Open Doors data portal. Here you will find Open Doors data tables for the current year, listed. You can browse the data from the past decade of Open Doors by topic, using the expandable navigation menu in the box at the right of the page. IIE has conducted an annual statistical survey of campuses regarding the international students in the United States since 1919, and with support from the U.S. Department of State's Bureau of Educational and Cultural Affairs since the early 1970s. The census is based on a survey of approximately 3,000 accredited U.S. institutions. Open Doors also conducts and reports on separate surveys on U.S. students studying abroad for academic credit (since 1985), and on international scholars at U.S. universities and international students enrolled in pre-academic Intensive English Programs. |
|
|
|
|
|
The Pew Research Centers Global Attitudes Project
http://www.pewglobal.org/ The Pew Research Centers Global Attitudes Project The Pew Research Centers Global Attitudes Project conducts public opinion surveys around the world on a broad array of subjects ranging from peoples assessments of their own lives to their views about the current state of the world and important issues of the day. Nearly 300,000 interviews in 59 countries have been conducted as part of the projects work. The project provides to journalists, academics, policymakers and the public a unique, comprehensive, internationally comparable series of surveys. |
|
|
|
|
|
The Speak Up (USA) National Research Project
http://www.tomorrow.org/speakup/ The Speak Up (USA) National Research Project The Speak Up National Research Project provides participating schools, districts and non-profit organizations with a suite of online surveys and reports to collect authentic feedback from students, educators and parents. In addition, we summarize and share the national findings with education and policy leaders in Washington DC and your state. Since 2003, educators from over 4,700 schools have used the Speak Up data to create and implement their vision for 21st century learning. |
|
|
|
|
|
10 Shocking USA Education Statistics : Infographics
https://www.flickr.com/photos/csmith/5587937982/ 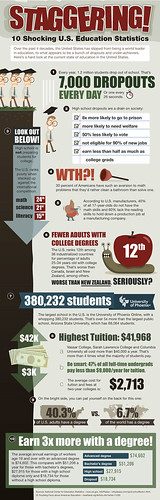
|
|
|
|
|
|
World Statistics
https://www.bouncymaps.com/#!/bouncymaps/world/-2102779806 World Statistics Browse our list of subjects, use our maps and animations for your own projects, comment on a map, or suggest your own map. Our data providers are the most authoritative sources in their fields. The data source is credited in the details section to the right of the map. |
|
|
|
|
|
Social Media Stats Visualized
https://mashable.com/2009/08/14/social-media-stats-visualized/ Social Media Stats Visualized |
|
|
|
|
|
Crime and Safety Surveys (USA)
https://nces.ed.gov/pubsearch/getpubcats.asp?sid=108 National Center for Education Statistics: Crime and Safety Surveys (CSS) USA "Compilation of school crime and safety data and reports, including the annual Indicators of School Crime and Safety (2002 to the present), and surveys of principals, teachers, and students. Includes reports on student discipline, victimization, gangs, bullying, weapons, drugs, and other school violence and crime topics. From the National Center for Education Statistics, U.S. Department of Education." |
|
|
|
|
|
ICT in Schools Statistics (USA)
http://www.schooldata.com/pdfs/Key_Findings_ADS_Report.pdf ICT in Schools Statistics (USA) America? Digital Schools 2006: A Five-Year Forecast provides your business with insight and analysis on the growth in one-to-one computing and extensive forecast of growth in purchasing by 2011. Through an exclusive distribution agreement with the study? authors, MDR customers can order this highly anticipated, 182-page report, including more than 250 data tables and charts, online now at www.schooldata.com |
|
|
|
|
|
Librarian's Index (USA)
https://bit.ly/1adJalS Librarian's Index (USA) ... list of over 100 education statistics resources and links. |
|
|
|
|
|
Internet Usage Statistics
https://www.internetworldstats.com/stats.htm Internet Usage Statistics ... World Internet Users and Population Stats |
|
|
|
|
|
Percentage of time spent on each subject
http://www.icteachers.co.uk/resources/resources_policies.htm An Excel spreadsheet, from Neil Whitmill, that calculates the percentage of time spent on each subject. Useful for Ofsted! Separate calculations for KS1 & KS2 |
|
|
|
|
|
PISA Study by OECD
http://www.oecd.org/pisa/ International survey of education standards : by the OECD (Organisation for Economic Co-Operation and Development) is known as PISA. It compares the performance of 15-year-olds in maths, literacy and science and comes out every three years. Are students well prepared to meet the challenges of the future? Are they able to analyse, reason and communicate their ideas effectively? Do they have the capacity to continue learning throughout life? These are questions that parents, students, the public and those who run education systems continually ask. PISA, a three-yearly survey (PISA 2000, PISA 2003, PISA 2006...) of the knowledge and skills of 15-year-olds in the principal industrialised countries, provides some answers. It assesses how far students near the end of compulsory education have acquired some of the knowledge and skills that are essential for full participation in society. |
|
|
|
|
|
The School Information Partnership (USA)
https://www.schoolresults.org/ The School Information Partnership (USA) The School Information Partnership is a public-private collaboration designed to empower parents, educators and policymakers to use the No Child Left Behind (NCLB) data to make informed decisions and improve school results. Standard & Poor's created the website which includes a suite of interactive analytical tools from Standard & Poor's School Evaluation Services and the National Center for Educational Accountability's Just for the Kids. For schools, districts and states across the nation, the website will display available data required to be publicly reported under NCLB. |
|
|
|
|
|
Literacy Facts and Figures : Asia and the Pacific
http://www.accu.or.jp/litdbase/stats/index.htm Literacy Facts and Figures : Asia and the Pacific The information at regional and national levels is the latest data taken from UNESCO and other international organisations, in particular UN, UNICEF and the World Bank. Some national level data that are not available from the international organisations, and all sub-national level data are officially derived from the government literacy agencies of the participating countries. |
|
|
|
|
|
National and international data sources and links
https://unstats.un.org/home/nso_sites/ National and international data sources and links National statistics links | International statistics links | References for international statistics | National publications and statistical yearbooks | current statistics and Internet sites | |
|
|
|
|
|
Childstates.gov (USA)
https://www.childstats.gov/ America's Children: Key National Indicators of Well-Being, 2000 is the fourth report in an annual series prepared by the Interagency Forum on Child and Family Statistics. This report provides the Nation with a broad annual summary of national indicators of child well-being and monitors changes in these indicators over time. The Forum hopes that this report also will stimulate discussions by policy-makers and the public, exchanges between the data and policy communities, and improvements in Federal data on children and families. |
|
|
|
|
|
The Condition of Education, 2001 in USA
https://nces.ed.gov/pubsearch/pubsinfo.asp?pubid=2001072 The Condition of Education summarizes important developments and trends in education using the latest available data. The report, which is required by law, is an indicator report intended for a general audience of readers who are interested in education. enrollment trends | student achievement | student effort | quality of elementary and secondary education | context of postsecondary education | societal support for learning | |
|
|
|
|
|
Internet Access in U.S. Public Schools
https://nces.ed.gov/pubsearch/pubsinfo.asp?pubid=2001071 Internet Access in U.S. Public Schools and Classrooms: 1994-2000 This Statistics in Brief presents data on Internet access in U.S. public schools from 1994 to 2000 by school characteristics. It provides trend analysis on the progress of public schools and classrooms in connecting to the Internet, the ratio of students to instructional computers and to instructional computers with Internet access, and the types of Internet connections used. It also provides, for the year 2000, information on student access to the Internet outside of regular school hours and on schools' acceptable-use policies. |
|
|
|
|
|
Key to Safer Schools
http://www.keystosaferschools.com/free-national-reports Educational Statistics on Health, Bullying, Safety, Intervention, Violence. Drugs, Adolescents, Crime. |
|
|
|
|
|
Education Statistics Quarterly (USA)
https://nces.ed.gov/pubsearch/pubsinfo.asp?pubid=2000606 The Quarterly offers an accessible, convenient overview of all NCES products released in a given quarter. |
|
|
|
|
|
UK: National Statistics
https://www.gov.uk/search/research-and-statistics Welcome to the National Statistics website. This site contains the latest comprehensive range of official UK statistics and information about statistics as well providing free access to a selection of recently released publications in downloadable pdf format. |
|
|
|
|
|
How much information is there in the world?
http://www2.sims.berkeley.edu/research/projects/how-much-info-2003/ This study is an attempt to measure how much information is produced in the world each year. We look at several media and estimate yearly production, accumulated stock, rates of growth, and other variables of interest. This study was produced by faculty and students at the School of Information Management and Systems at the University of California at Berkeley. |
|
|
|
|
|
Projections of Education Statistics to 2010
https://nces.ed.gov/pubsearch/pubsinfo.asp?pubid=2000071 This publication provides projections for key education statistics in USA. It includes statistics on enrollment, graduates, teachers, and expenditures in elementary and secondary schools, and institutions of higher education. For the Nation, the tables, figures, and text contain data on enrollment, teachers, graduates, and expenditures for the past 14 years and projections to the year 2010. |
|
|
|
|
|
The Condition of Education, 2000 USA
https://nces.ed.gov/pubsearch/pubsinfo.asp?pubid=2000062 The Condition of Education is an indicator report, summarizing the health of education, monitoring important developments, and showing trends in major aspects of education. The 65 indicators included examine relationships; show changes over time; compare or contrast sub-populations, regions, or countries; or assess characteristics of students from different backgrounds and types of schools. |
|
|
|
|
|
Higher Education Statistics Agency
https://www.hesa.ac.uk/ The Higher Education Statistics Agency (HESA) is a central body responsible for collecting and compiling statistical data on Higher Education establishments in the UK. It receives data from all the UK Universities, including the former Polytechnics. This data is held centrally and analysed to give trends in Higher Education. |
|
|
|
|
|
Teacher Use of Computers&Internet USA
https://nces.ed.gov/pubsearch/pubsinfo.asp?pubid=2000090 This Statistics in Brief discusses public school teachers use of computers and the Internet and their feelings of preparedness to do so. The Brief examines teachers own applications of these tools as well as the assignments they give their students to use computers or the Internet. |
|
|
|
|
|
Many USA Statistics on Education
https://nces.ed.gov/pubsearch/pubsinfo.asp?pubid=2000031 The Digest provides a compilation of statistical information covering the broad field of education from prekindergarten through graduate school. Topics in the Digest include: the number of schools and colleges; teachers; enrollments; graduates; educationa l attainment; finances; federal funds for education; employment and income of graduates; libraries; technology; and international comparisons. |
|
|
|
|
| use this box to search more on Shambles (powered by Google) : safe filtering is ON | |||
|
|

Custom Search
|
||
|
Custom Search
|
|
|
webpage with others |
|
 |
|
.jpg) |
|
.jpg) |
|
|
|
|
|
| |
©
copyright The Education Project Asia |
|
 |
|
QR Code Shambles mobile gif.gif) |
|
.jpg) |
|
.jpg) |


.jpg)
jpg.jpg)
jpg.jpg)